Charted: Global air pollution
World Air Map visualises pollution across every part of the world.
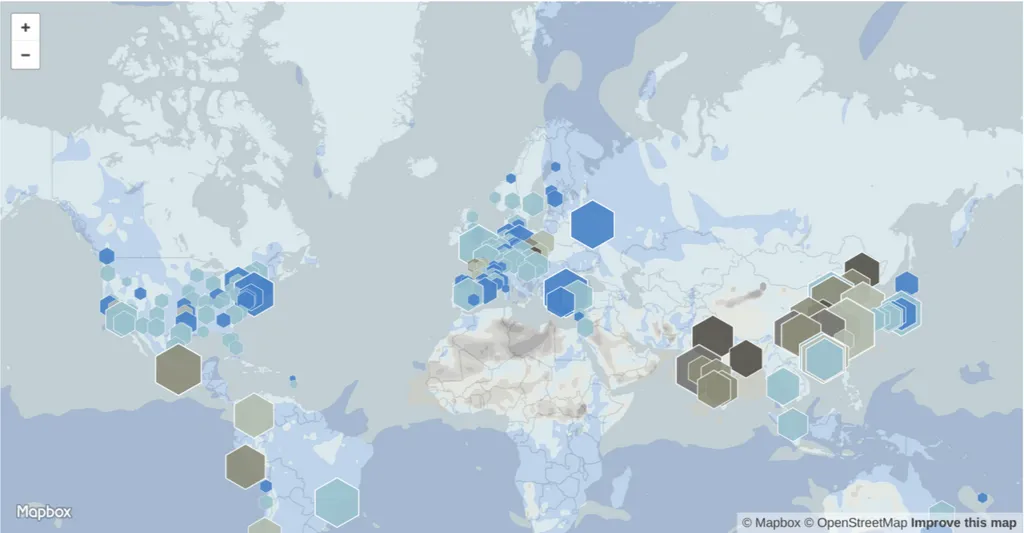
 Clicking on a hexagon brings up an “air report” of the city with the its current and average air quality index, and index of pollutants including ozone, nitrogen oxide, particulate matters and sulfur dioxide. The index is categorised into four levels of pollution and their associated health risks to make it easier to understand - fresh air, moderate, high, very high or extreme pollution.
Each city report also gives recommendations for daily do’s and don’ts based on the quality of the air. There are currently four activities - outdoor sports, cycling, bringing your baby out and eating outside. For each of the activities, the report recommends residents to “take care”, “take it easy” or “go for it”.
The map is paired with an app, a handy way for urban residents to get personalised alerts on pollution levels.
The World Air Map can be viewed on this website: air.plumelabs.com. The app is available for Android and Apple phones.
Clicking on a hexagon brings up an “air report” of the city with the its current and average air quality index, and index of pollutants including ozone, nitrogen oxide, particulate matters and sulfur dioxide. The index is categorised into four levels of pollution and their associated health risks to make it easier to understand - fresh air, moderate, high, very high or extreme pollution.
Each city report also gives recommendations for daily do’s and don’ts based on the quality of the air. There are currently four activities - outdoor sports, cycling, bringing your baby out and eating outside. For each of the activities, the report recommends residents to “take care”, “take it easy” or “go for it”.
The map is paired with an app, a handy way for urban residents to get personalised alerts on pollution levels.
The World Air Map can be viewed on this website: air.plumelabs.com. The app is available for Android and Apple phones.